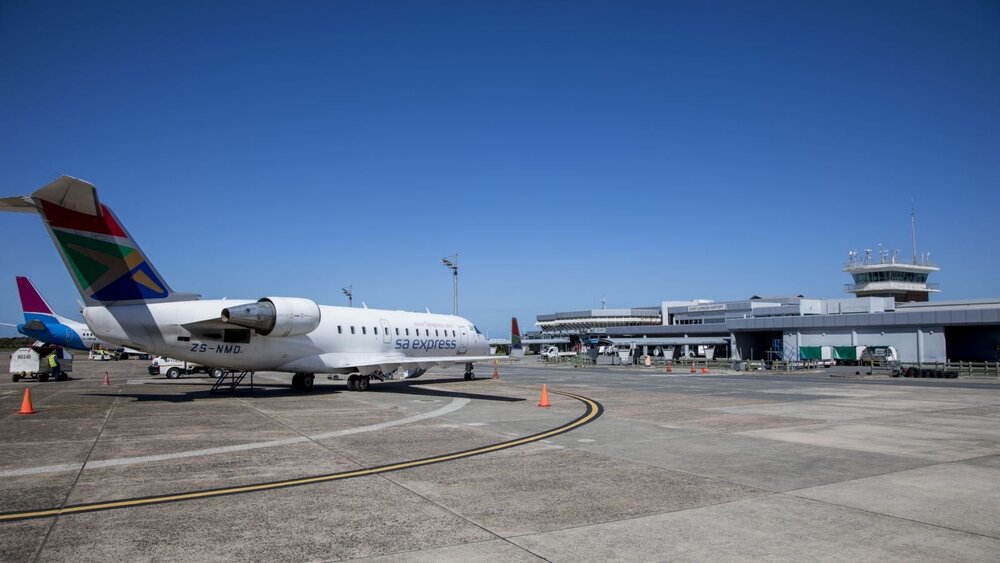
A late flight can turn an ordinary South African trip into a scramble for a new connection, a longer airport wait or a missed booking. The latest comparable figures show a gap of more than 11 percentage points between the carrier with the highest late-flight share and the one with the lowest.
Also see: South Africa lands three new direct international flight routes
Data specialists at Play Casino compared the five carriers listed across the same four Airports Company South Africa (ACSA) airports, converting each published on-time percentage into a late-flight share. Their analysis puts CemAir at the top of the late-flight table and FlySafair at the bottom.
How the airlines were ranked
ACSA uses a 15-minute benchmark for on-time performance. A flight is counted as on time when its actual on- or off-block time is within 15 minutes of the scheduled time.
The ACSA data covers both arrivals and departures, meaning this ranking focuses on late flights rather than treating every figure as a departure-only measure.
To keep the comparison like-for-like, the analysis used O. R. Tambo International, Cape Town International, King Shaka International and Chief Dawid Stuurman International airports, where all five carriers appear.
The figures are based on the year-to-date 2026 data in the table and do not include the separate June 2026 column.
1. CemAir – 19.93% late flights
CemAir recorded the highest late-flight share among the five airlines, with 80.07% of flights on time and 19.93% late.
This translates to approximately 19.93 late flights per 100 on the comparison’s percentage basis.
Its four-airport average is pulled down by its 73.20% on-time performance at O.R. Tambo, its lowest result in the common set. At Chief Dawid Stuurman International, however, CemAir recorded a stronger 85.14% on-time rate.
2. Global Aviation – 13.61% late flights
Global Aviation recorded an 86.39% on-time rate, leaving a 13.61% late-flight share.
Its results across the four common airports varied considerably, ranging from 78.28% on time at O.R. Tambo to 100% at Chief Dawid Stuurman International.
While the perfect result at one airport helps lift the overall average, weaker performances at other airports still affect the carrier’s ranking.
3. South African Airways – 12.80% late flights
South African Airways (SAA) recorded an 87.21% on-time average, equivalent to approximately 12.80 late flights per 100 on the comparison’s model.
SAA’s strongest result among the four airports was 90.83% in Cape Town.
Its lowest performance in this comparison came at Chief Dawid Stuurman International, where the airline recorded an on-time rate of 78.76%.
4. Airlink – 9.82% late flights
Airlink performed better than the first three carriers, recording 90.18% on time and 9.82% late.
The airline recorded on-time rates above 89% at Cape Town, King Shaka and Chief Dawid Stuurman International.
However, its 87.39% result at O.R. Tambo brought down its overall average and kept it behind the strongest-performing carrier in the comparison.
Also see: Emirates Brings Premium Economy To South Africa With Refreshed Boeing 777
5. FlySafair – 8.28% late flights
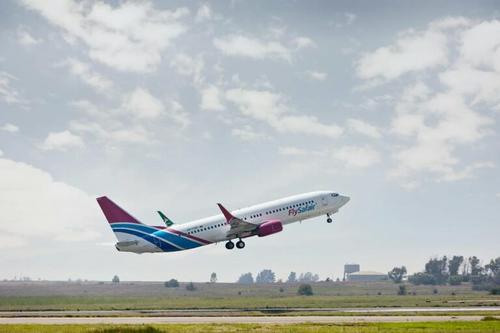
FlySafair recorded the lowest late-flight share among the five carriers, with 91.72% of flights on time and 8.28% late.
The airline recorded an on-time rate of at least 90% at each of the four airports included in the comparison.
Its strongest result was in Cape Town, where 93.37% of flights were on time, giving FlySafair the highest average in this like-for-like snapshot.
What the numbers mean for travellers
The figures highlight a difference of more than 11 percentage points between CemAir’s 19.93% late-flight share and FlySafair’s 8.28%.
However, the data should be viewed as a broad performance comparison rather than a guarantee that a particular flight will arrive or depart on time.
As the data specialists noted, “The useful takeaway is the gap between the published rates, not a promise that one airline will be on time on a particular day.”
Travellers should still check the status of their specific flight, route and airport before heading to the airport, particularly when travelling with tight connections or time-sensitive bookings.
How the comparison was calculated
ACSA reports airport-level year-to-date 2026 on-time percentages for its Home Airline entries.
The analysis used the four airports where all five carriers are listed and calculated each airline’s simple mean across those airports. The resulting average was then subtracted from 100 to determine the late-flight share.
The figures are rounded to two decimal places and are not weighted according to flight volume.
This means the ranking provides a like-for-like snapshot of the published figures across the four common airports, rather than an estimate of the absolute number of delayed flights operated by each airline.
Also see: Airlines to introduce adult-only zones
Be the first to know – Join our WhatsApp channel for content worth tapping into. Click here to join!